Introduction
SigPlot is a plotting solution from LGS Innovations for web-based applications which we’ve used in previous demos of our own web UI, and the REDHAWK SDR group used in their RTL Demo App from a few years back. The library provides for a number of features and plugins that can make for many plot styles like this:
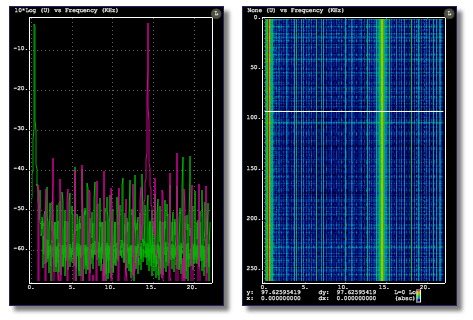
Unfortunately, the only way one can use it is to pull the minified library from an existing app and re-use it…until a few weeks ago.
Recently, LGS Innovations offered us the chance to begin integrating SigPlot into our TypeScript -based workflow ahead of their source release and subsequent NPM release. Naturally, we took them up on the chance, and coinciding with their releases, we’ve added Typings definitions to many of their modules in our fork followed by releasing a TypeScript integration library and Angular Components.
Consequently, if you’re interested in supporting SigPlot’s development, you can join them on Slack.
SigPlot TS
SigPlot TS is an integration library that adds a variety of extensions to the typings in our fork of SigPlot. These extensions include utility classes, extra interfaces, and enumerations — all with the goal being to clarify what settings can effectively control which feature and aid in readiability of code. The library also includes a few controller classes for specific types of plots to simplify integration.
Q: So you hid everything?!
A: No, you still have access to the full SigPlotPlotinstance as well as a base class controller to extend if you have something special in mind.
Why TypeScript?
Why one would chose TypeScript over CoffeeScript or straight JS can sometimes come across like a religious discussion. Our reasoning for using TypeScript for UI development over the last year has been for a variety of reasons.
First, TypeScript provides build-time sanity checks of your interfaces and types. So those of us who are more strong-typed (firmware, embedded) folks can rejoice a bit since there’s a much stronger check of the system ahead of trying to debug the JS at runtime.
Second, TypeScript, like CoffeeScript, is transpiled to JavaScript. In fact, it can be transpiled to a variety of module definitions from the same source files so that one can support multiple downstream needs, which has the potential of reducing code maintenance.
Q: Does that mean I must to use TypeScript to use SigPlot TS?
A: No, you’ll have access to all the same classes, etc. It’ll just be easier to use with all of the extended Typings support it provides for sanity-checking builds.
Usage
It’s an NPM module, so npm install --save sigplot-ts will give you the latest version along with the version of sigplot against which it was developed. All of the typings from sigplot are re-exported under the sigplot-ts module, so you will have access to everything including the generalized plot controllers:
import {
    RasterPlot,
    RasterPlotData,
    FormatSize,
    FormatType
} from 'sigplot-ts';

let plot = new RasterPlot(dom_element);

// When data is received
const data: RasterPlotData = {
    buffer: data_vector,
    dataSize: FormatSize.Scalar,
    dataType: FormatType.Float32
};

// Push the data
plot.push(data);
Our goal with this library is to make it as simple as the above to create a Raster Plot (e.g., a PSD waterfall) and feed live data into it. There are additional, optional settings available as well for managing the X and Y axis settings as well as updating plot labels, which you can find in the documentation.
SigPlot NG
Where SigPlot TS is the TypeScript integration, SigPlot NG is a package providing Angular 4+ Components that wrap the SigPlot TS plot controllers. In this case of course, you would need to be using Angular for your web application in order to use sigplot-ng.
Why Angular?
Like picking a transpiled language vs. straight JavaScript, picking a web framework sometimes turns into a religious discussion. For us, the main reason is in the dependency injection system.
Our previous demos used our Angular-REDHAWK framework, based on Angular 1.5 in concert with our version of REST-Python, to setup dynamic web UIs that can integrate with REDHAWK systems. The dependency injection system for taking a REDHAWK entity and spinning up a self-contained non-generic entity at the client was good, but required quite a bit of boilerplate code to get working well. So when we heard they were revamping the Factory vs. Service construct, we began migrating up to 2, then now up through 4.
A new version of Angular-REDHAWK is coming soon, which uses Angular 4+ Directives and Services to rapidly scaffold a UI. So through dependency injection, you’ll be able to do this:
But more on that later — back to SigPlot-NG. 🙂
Usage
Similar to SigPlot TS, use NPM to install it: npm install --save sigplot-ng. Then in the module where you want to use the components:
import { SigPlotComponentsModule } from 'sigplot-ng';

@NgModule({
  imports: [
    // ...other imports
    SigPlotComponentsModule
  ],
})
export class YourModule {}
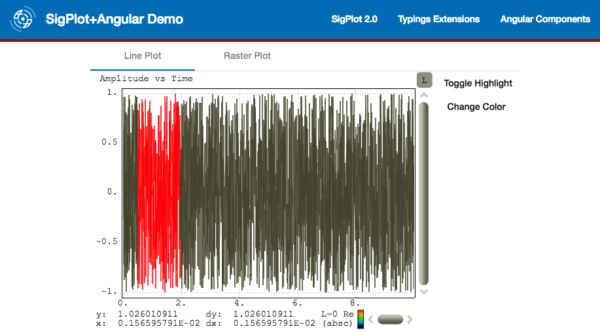
You will then have access to the available component directives as well as the ability to subclass the base directive to create your own. For example, an instantiation of the Raster Plot where we’re feeding in an observable for the data stream and taking control over the color scheme (colors and cmap, the color map).
Contributing
As always, these are all freely available and open-source, available on our GitHub. If you would like to contribute, please feel free to submit pull requests and issues. We are looking forward growing this capability going forward.
Live Demo
These packages are all early betas, so expect changes as we will be adhering to the major-minor-patch typical version scheme.